Some of the most common challenges we hear about from customers are things that might be all too familiar to some of you. Things in IT have always changed rapidly, and it’s only picking up speed. The explosion of DevOps, cloud-centric architectures, and software-defined networking are making it increasingly difficult to keep monitoring and management tools in sync with the environment.
This leads to another issue – management and individual teams lack visibility into the whole environment. Most existing enterprise network management tools are slow to adapt to the rapid changes and deployments that are becoming routine in most organizations.
We find this is often because visibility suffers when it’s difficult and labor-intensive to manage. If a manual process is required to add monitoring onto new systems, there’s just no way it’ll ever stay up to date.
Often, this lack of an up-to-date view across the organization leads teams to implement their own point solutions, and the more tools you’re dealing with, the more likely they are to contradict each other, to say nothing of the increased admin and training burdens, and the communications issues this can cause.
Fortunately, most of these challenges can be solved the same way – Automation. We need a way to keep up with rapid and dynamically changing environments, while maintaining visibility, avoiding blind spots, and keeping up our SLAs. And all while not creating additional admin overhead that no one has time for.
Automation is something we have been working with at Netreo for many years now, and we define automation maturity in 4 main stages:
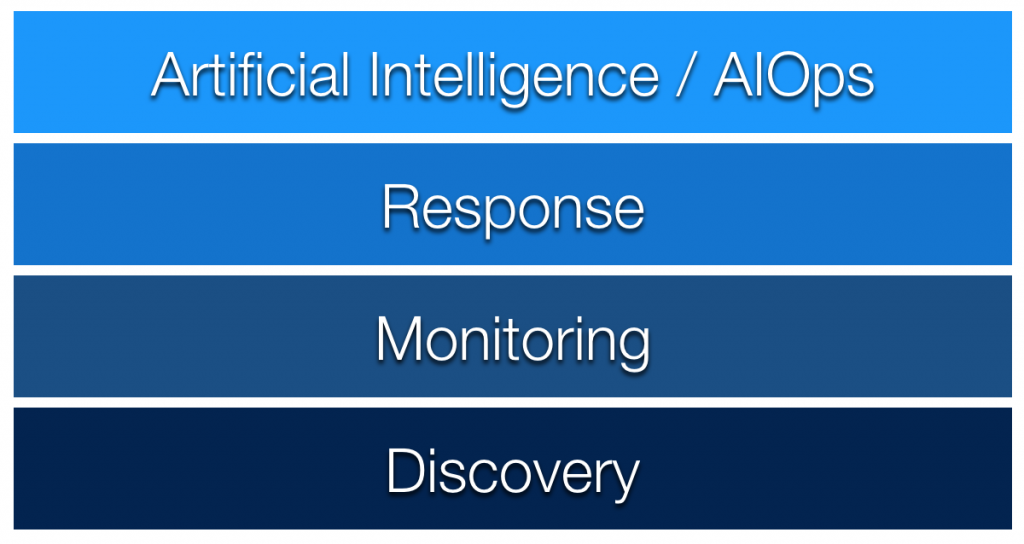
Discovery, Monitoring, Response, and Artificial Intelligence or AIOps. Over the last 20 years of development, our platform has evolved to do all of these. Let’s look at each of them, and you can start to see where your organization might be today, and what the next steps might be.
The first stage of automation is discovery automation. Now, this technology has been around in its most basic form forever. We’ve probably all used tools that do a ping sweep or a port scan to find devices on the network. That technology still makes sense in a lot of environments, but it’s not the whole answer anymore.
Today, auto discovery has changed a lot. There are a lot of things you can’t scan reliably – isolated virtual systems, DMZs, cloud systems, and micro services, just to name a few.
Modern systems leverage the power of API integrations to make automated discovery faster, more reliable, and much more complete, without creating network traffic problems.
For example, we leverage these APIs to learn directly from systems like ServiceNow CMDB, vCenter, Azure, and AWS, as well as SD-WAN orchestrators. And we provide inbound API calls to allow users to link our system with existing workflows like Puppet/Chef, or to create additional custom integrations easily, without relying on expensive consultants.
The next stage is monitoring automation. This is where adding new devices to monitoring, and getting them correctly configured, no longer requires manual intervention. For many organizations we speak to, they haven’t even really gotten this far yet. There are a few reasons for that, but one of the most common is that a lot of monitoring platforms are surprisingly underdeveloped in this area, and in-house development resources are scarce and expensive, when they exist at all.
To reach this stage effectively, the management platform must be able to identify new systems not just at the OS level, but also detect things like which services or applications are running on them, in order to make the right decisions about what exactly you need monitored on that system.
For example, bringing up a SQL server as a VM should enable monitoring of the OS, virtualization stack, the SQL application itself, appropriate event log monitors, who to alert when it has a problem – and that might be different depending on a SQL problem versus an OS problem – and what kind of performance metrics and statistics to watch on it. It also has to include putting it in the right categories, sites, and business workflows – the groupings that drive your reporting – so that newly deployed systems always show up in the correct reports, and nothing falls through the cracks.
The third stage is response automation. This enables your management platform to take independent action to remediate a problem before your NOC or engineers have to do anything.
In order to effectively automate response this way, we have to allow different actions based on things like time of day or day of week – in case you want a different response during business hours, for example. It should also allow for dependencies – like taking a different action if there are other servers running the same application that are having a problem at the same time.
And of course, there should be the ability to do this across platforms – be they routers, Windows, Linux, Switches, or cloud hosting providers. This requires different methods of interaction with those devices, as some will require JSON API calls, and others might need SSH, powershell, or even telnet.
Now, this can be a big step, and some organizations will insist on operator intervention at least to approve the action before it’s taken – the so called “click to reboot” button. This is a good idea for drastic actions, but it also lets organizations get comfortable with the process and validate their configuration before fully automating the response actions. Our platform supports doing this either way.
The final stage is AI-based systems. If you thought the last step was a big one, this is well beyond that. While there’s obviously a lot of different definitions around what exactly constitutes AI, We use the term here to define systems that can make autonomous decisions. This is something that is often referred to as “AIOps,” which is really just applying AI techniques to your regular operations.
For example, the system can look at the alerts coming out of your monitoring platform, and detect that a certain kind of alarm is happening too frequently and is likely a false alarm, and then suppress those alarms, or modify your settings to stop them from happening. Or it might notice a correlation between specific log messages and a later application failure and restart some services automatically to remediate the issue, since that worked last time the application failure occurred.
Ideally, an AI management system will make these connections and potentially take actions based on learning your environment as well as best practices and scenarios encountered across other customers. It’s critical to be able to decide which actions to allow to happen completely autonomously, and which should require operator intervention, especially at first.
The largest potential downside of AI is that it drives very high resource requirements, often beyond what is practical to provision yourself. This generally means you need to have some cloud-hosted resources helping out in order to sort through all the data that’s coming into the system, and that is going to drive a connectivity dependency for full functionality.
So the first key to automating your IT management is to make sure we’re taking full advantage of discovery and monitoring automation. Obviously the first step here is to use our auto discovery tools to make sure that new devices are added into monitoring as they’re provisioned.
Once the devices are identified, we need to make sure we’re getting full monitoring automation on them as well, so we want to make sure we’re identifying all the different applications or services that we need to monitor on those systems.
Our platform uses a configuration system based on Cascading Templates that makes this a lot easier. Using cascading templates, we can have multiple templates apply to the device or application as appropriate.
Our approach to auto-discovery takes three parallel paths, so nothing gets missed. Of course, we have configurable subnet scanning, so that we can quickly identify new systems as they’re provisioned. This is the traditional method most tools use.
However, we also want to leverage other discovery methods that provide quicker or more detailed information, so we implement API connectivity to multiple vendor platforms to be able to find new Meraki edge routers as you bring them online, for example, or quickly start monitoring new AWS instances or new virtual machines.
We also provide open inbound APIs for system provisioning, so if you’re using deployment automation tools like Puppet, Ansible, or even just python scripts, you can link monitoring into that process.
By using all three methods simultaneously, we can make sure that nothing gets missed, even if things are changing rapidly or dynamically, and even if someone didn’t follow the deployment process checklist as precisely as they should have.
To get this to the next stage, we really need to then take that discovered device data and make sure that it’s getting fully provisioned. It’s useful if a new system gets detected and added to monitoring, but it falls short of getting full visibility if we’re not also watching the critical applications and services, or if we’re not automatically sending notifications to the right team when something isn’t working right.
Our approach to this problem is using a feature we call “Auto Configuration.” Auto configuration comes with a set of rules to help you get started, and they can easily be customized or created to fit your environment. You can use these to set device attributes, like categories, site, and business workflows based on any device criteria – including things like which processes are running, what ports are open, what the device is named, or even SNMP values. This makes sure that there’s no manual provisioning process to make sure the devices end up in the correct reports, and they always get the right settings applied.
These are automatically applied to devices as they’re discovered, regardless of what method is used to add them in or what platform they’re running on, and can also be re-applied automatically, or as desired, so if you want to make sure everything stays configured the way you want, you can enforce that.
But to close the loop on that automation, once the attributes are applied, our platform dynamically applies all the relevant templates to your devices. This ensures that all the settings you need applied to the new device are applied without manual intervention.
So, for example, a new SQL server coming on line would not only get the basic Windows server settings you want, but would also get the SQL-specific application checks and settings, and the SQL team will get alerted whenever there’s a problem with it. We can also pre-define the event logs to look for and report on, and set the performance metrics we want to watch.
You can use templates to define authentication, escalation, logging alerts, configuration rules, active response automation actions, and more. It’s designed to be flexible enough to meet the needs of the global enterprise customer while still being simple enough for a small IT department to use without a lot of training or dedicated personnel.
Now that we’ve automated the process of getting new monitoring provisioned, the next level of automating your monitoring includes automating your response. This allows you to take appropriate actions in the event of a failure, or even an anomaly, by automatically executing commands on devices or sending API calls to your applications or cloud providers.
You can link in CLI commands like SSH or powershell, or use APIs like web hooks so your monitoring system can restart ports, deploy additional containers, retest applications, or even dump real-time diagnostics in response to an incident.
Some people are uncomfortable with automatically executing commands, so our platform allows you to control those commands manually through operator intervention, if you prefer. That way, if you want to add a ‘click to restart server’ function directly into the web interface of the monitoring system, and limit access to just administrators, there’s an easy way to do that.
One customer even set the system up to restart the server automatically after hours, but only notify the NOC during business hours, so they can make the decision when they’re available.
One important item to keep in mind is that if you’re automating response, maintenance windows become absolutely critical. Otherwise a scheduled software upgrade may not go as you expect, as your monitoring system starts taking action in the background. Nothing is more frustrating than pausing an application service for a deployment and having the server suddenly reboot. We make that easy though – you can create maintenance windows via the web interface, mobile app, or even via API, to tie it directly to your change control or trouble ticketing system.
A key part of automating incident response is using what we call “Incident Management.” This is the process we refer to that allows the platform to understand complex or advanced dependencies, with the goal of reaching zero false alarms.
This is a rule-based system that allows you to easily override configured actions in order to send a customized alert, suppress a redundant alarm, or automate a specific response. One example of this is a customer who had a lot of remote retail locations with limited bandwidth. Once they detected that the site was getting congested, they’d schedule a circuit upgrade, but that takes 30-45 days. So they made a rule that intercepted any bandwidth or latency alarms for that site and sent a message to the branch manager letting them know that they knew about the problem, and the upgrade had already been ordered – and managed to reduce those calls into their NOC by 80%.
You can configure dependencies based on grouping – for example, if you are seeing a bandwidth issue on a site, you could suppress any latency alerts for the same location. Or, if you are running a cluster of systems, you can take a different action depending on the state of other cluster members at the time.
To really take advantage of automated response, we want to make sure we’re removing false alarms as well as finding hidden issues. Detecting unusual behavior, instead of just relying on static alarm settings, is a key way to make this work.
In our platform, you can use our anomaly detection feature to find changes in application behavior, and it can be applied almost anywhere – CPU, memory use, running processes, even log messages. For example, if your application goes from 10 login failures an hour to 1000, that last deployment may not have gone as smoothly as you expected, and now you have a starting place to troubleshoot.
We will automatically generate a baseline behavior model using the large volume of historical data we retain (usually 100 days of high resolution data by default), and we’ll automatically adapt the baseline as your environment dynamically changes and evolves. Anomalies can be detected based on changes in baseline behavior looking at time of day, day of week, or even hour by hour.
This allows you to find unexpected impacts, like a software change causing unusual behavior in CPU on a back-end SQL server. One customer of ours discovered an issue where normally at 10am on a Wednesday, the database server runs at 50-60%, but suddenly it was running at 15%. It turns out that a change pushed to the UI the previous night put a test API key into the app instead of the production one, and customers couldn’t complete their orders. That sort of anomaly is the kind of unusual behavior that would never trigger an alert based on a static threshold, but in this case revealed a problem long before they noticed the sharp drop in orders that would have resulted.
Even after automating the process of finding new things to monitor, and automating the process of setting all that monitoring up, we still have the task of regularly reviewing what’s going on in the environment, tuning to reduce false alarms, and optimizing our motioning configuration. So in order to get to the 4th stage of automation maturity, now we’re going to be leveraging the power of AI and machine learning to help us keep the environment running and monitored.
 The first phase of this is an automatic administration tool we call AI Autopilot, where we are using AI tools to evaluate how our systems are configured, what performance metrics and thresholds we’re using, and analyzing how those are performing in our environment, in essence, the AI is looking at the reports for us, so it can make recommendations or changes.
The AI Autopilot system can automatically identify common configuration issues or integration problems, for example finding systems where the authentication credentials were changed and the monitoring system wasn’t updated, and finding the correct ones and automatically applying them – so we don’t miss any performance data or alerts. It can also look at what other customers are doing and develop best practice recommendations, to point out things that might be configured unusually or where a more optimized way to monitor something exists, and then it can provide recommendations, so an administrator can apply them with a single click, or even deploy the changes automatically.
Since this is fully automated, it’s just a matter of switching it on, and deciding if you want it to ask for approval before making changes. The AI Autopilot examines the configuration of all of the different system elements, and then looks for things it can optimize, things that are misconfigured or not integrated properly, or things that are configured in a way that’s contrary to best practices, and then provides reports and recommendations, including a manual approval process, if desired, before it automatically applies the approved changes to the various configurations within the platform.
This effectively reduces the training and administration load, as well as insures that the tool can stay optimally configured for your environment without a large time investment. The recommendations and best practices are continually updated from the cloud, to make sure that as our customers find new and more efficient ways to do things, or the industry standards change, your platform can continually stay up to date.
The next phase of AI development includes the ability to generate automated reports without being asked. So, for example, if the system detects there’s a pattern developing that looks like a capacity issue, even if you don’t have a capacity planning report scheduled to run automatically, it could generate and send you one with an explanation of why you might want to take a look at those particular systems or circuits. Or to recommend reports that other people in your industry are finding useful and then automatically set them up for you.
It will also include optimized active response, where when a new issue is detected, if other customers have successfully automated the resolution for that issue, the system might recommend actions to you based on what worked for other customers with similar environments.
It also includes the ability to use AI for advanced types of root cause analysis and event correlation, including predictive correlation. For example “85% of customers who saw this type of log message 10 times in 1 day had a service failure related to high memory utilization within 24 hours” and then provide options to potentially prevent the issue, like scheduling a service restart or a server reboot.
With automation, you can get a clearer view of your systems far more quickly. Start a 14-Day Trial to experience Netreo’s full-stack monitoring and AIOps capabilities today.