Digital transformation is causing the IT ecosphere to evolve, and the evolution is being accelerated by competitive necessity. Enterprises are using digital technology to increase revenue and lower costs. Failure to compete effectively will have devastating consequences.
Digital transformation requires that IT evolve from a cost center to a value creator. FinOps and DevOps are processes that include the entire enterprise in value creation. IT and especially cloud costs are viewed as investments that create a return.
The speed of transformation has fueled cloud adoption. According to Gartner, over 92% of enterprises use the public cloud. In addition, Gartner speculates that 81% will use multiple clouds or a hybrid cloud model.
This blog post will discuss the importance of having a unified monitoring platform to implement and manage digital transformation initiatives.
Monitoring has evolved from its traditional ITSM function into a data provider for a variety of business processes. For example, web usage statistics give marketing insight into campaign effectiveness. This creates the need for full-stack monitoring.

The full stack consists of the entire application ecosystem. Therefore, this includes everything from bare metal to the end-user interface. Base infrastructure, network, application infrastructure, database, business logic, APIs, and end-user interfaces are some of the major full-stack components. Full-stack monitoring is integrating the full-stack alerts, messages, log files, metrics, and other telemetry information into a single observability platform.
End users make the final decision on the success of your IT initiatives. An SLA should delineate their expectations. Full-stack monitoring is essential in meeting SLA requirements. Application problems can be caused anywhere in the stack. For example, anything from a bad port on a switch to a misconfigured API can cause performance issues. Therefore, it is critical to understand the behavior of the full stack.
Full stack requires monitoring ephemeral workloads with potentially different codebases. They are networked via APIs across multiple clouds with proprietary management interfaces. In addition, workloads traverse hybrid infrastructures of hardware- and software-based switches, routers, and security appliances. The underlying network consists of multiple carriers. These carriers provide everything from SD/WAN to open internet connections. A problem anywhere in the stack can affect the ability to meet SLA requirements.
There are different monitoring complications, and it’s important to know about the specific ones you might run into.
How do you keep track of configuration changes, ephemeral workloads, hardware, virtual servers, and network appliances across a geographically dispersed infrastructure with multiple management interfaces and consoles? In a word, it is basically impossible.
Each cloud provider has a proprietary management interface. The interface provides monitoring information. However, someone needs to integrate and correlate the messages from every source to understand infrastructure and application behavior.
In addition, there are often multiple interfaces in stack layers. Once again, someone needs to figure out how all these alerts and messages relate. This complicates incident and performance management and therefore jeopardizes meeting SLA requirements.
Effective troubleshooting and planning require understanding how everything is connected. Modern software relies on distributed API-connected services. Communication between services, databases, and other stack resources flow across a distributed infrastructure. Rapid deployment and constant change make it impossible to keep topology and dependency maps accurate and up to date.
It is important to understand the baseline behavior of your stack. This helps you establish thresholds. Threshold exceptions inform you of anomalous infrastructure behavior. This is a warning of potential problems or security violations. In addition, you have to understand your baseline before you add additional applications. This will let you model their impact on your infrastructure.
This is virtually impossible without a full-stack view of the infrastructure. Each individual stack component has its baseline behavior. However, behavior across the stack needs to be modeled as well. Once again, there are so many dependencies that need to be understood in order to meet SLA and deployment requirements.
The various stack layers are constantly sending out alerts and messages. An issue in one stack layer can trigger a cascade of alerts from the other stacks. It is difficult to impossible to make sense out of all this information. This is particularly true when they are not consolidated into one management console.
It is critical to monitor vendor performance. Vendor performance impacts your ability to meet your SLA requirements. Therefore, you must measure whether your vendors are in SLA compliance. First of all, you want to collect any penalties for noncompliance. Secondly, you need to understand the impact of a vendor’s service on your operations.
Vendor TAC engineers require detailed log traces and alert logs. In addition, a very clear presentation of the problem reduces resolution time. It is important to isolate their alarms and logs from the rest of the stack’s alarms. However, this is very difficult if there are multiple alert sources triggered by the same root cause.
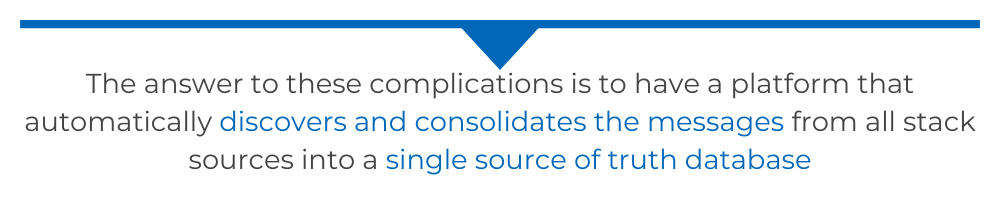
The answer to these complications is to have a platform that automatically discovers and consolidates the messages from all stack sources into a single source of truth database. Subsequently, the platform AI and ML engines analyze, filter, and correlate the data. As a result, there is a single source of truth.
The Netreo platform creates a single source of truth. It accomplishes this by integrating with stack layers and infrastructure components via API, vendor-specific integrations, and standard protocols such as SNMP. For example, Netreo supports direct API integrations with AWS, Azure, and Google Cloud. You can learn more about Netreo’s supported integrations.
The result is an integrated database that automatically detects configuration changes. Netreo’s platform uses rules, AI, and ML to analyze the data. As a result of the ongoing analysis, Netreo is able to filter and correlate alerts and messages from the full stack. Netreo displays the results in a single pane of glass monitoring interface. The system shows meaningful results. Therefore, Netreo presents a simplified, precise, and meaningful observation platform with its Intelligent Alert Management.
Netreo enhances observability by automatically creating network maps and topologies. Consequently, this frees staff from manual updates and ensures topology accuracy. In addition, Netreo determines baseline line statistics from cross-stack layers. The system automatically generates threshold exception reports. In addition, Netreo can isolate statistics to measure staff and vendor performance.
The digital transformation rush has initiated a fluid, complex, and unpredictable IT environment. There are not enough human resources to keep up with this chaos. Hence, the whole process needs to be automated and simplified. Otherwise, it will be impossible to meet SLA requirements.
Fortunately, companies such as Netreo have developed platforms to manage this chaos. Certainly, Netreo’s process of “observe, analyze, and act” creates order out of digital transformation chaos. AI and ML reduce the complications and produce a single source of truth automated database. Staff is freed from the tedious and stress-inducing process of understanding a plethora of full-stack alerts. The Netreo platform automates underlying processes to reduce human error and increase resolution speed. In addition, Netreo generates detailed reports for IT and non-IT stakeholders.
At the present time, effective multi-cloud and full-stack monitoring and management is impossible without AI and ML support. Netreo offers a path to simplified monitoring that helps you meet today’s demands and challenges.
Marcus McEwen wrote this post. Marcus is a serial entrepreneur. In 1996 he used a $60,000 investment to build a managed service provider that generated a 25% net profit. His company, Equivoice, was certified as a Cisco Master Service Provider. Equivoice was sold in 2016. After the sale he used his entrepreneurial skills to build an organic farming operation and an Atlanta based Airbnb business. Marcus’s peers respects him for his technical and management skills.